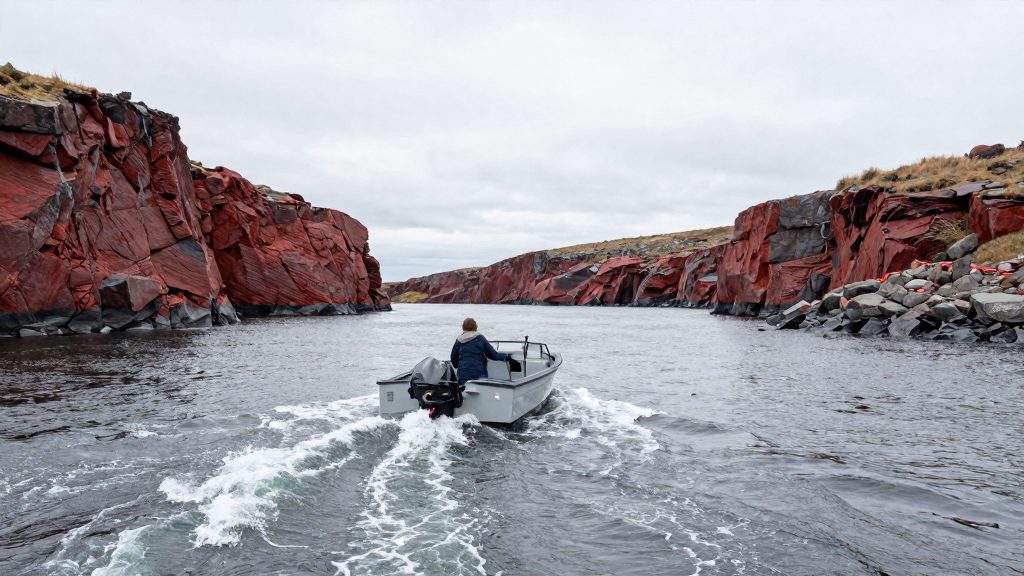
To read tide tables for the Bay of Fundy, start with the official Canadian Tide and Current Tables, Volume 1, Atlantic Coast and Bay of Fundy, published by the Canadian Hydrographic Service (CHS) of Fisheries and Oceans Canada. The volume gives daily high and low water times and heights for reference ports, time and height differences for secondary ports, and the times of slack water and maximum current. Every height is referred to chart datum, so before you act on any figure, confirm which port it belongs to, which water level it measures from, and which time convention the book uses.
What do the Canadian Tide and Current Tables cover?
The publication is an annual, bilingual English and French digital document in PDF form. Its catalogue record (Fs73-1) lists editions from 2019 onward, up to the 2027/01 edition, so the first task is to make sure you hold the edition for the current year. An older edition is not a substitute, even when the port you need looks unchanged.
Volume 1 covers the Atlantic Coast and the Bay of Fundy. The 2024 edition contains tide tables for reference ports such as Saint John, Yarmouth and Halifax, and a current table for the Grand Manan Channel. Its structure is the key to using it correctly. Reference ports list every daily high and low water. Secondary ports are not listed in full: they appear only as differences from a reference port, so a secondary port is never read on its own.
How do you convert a reference port prediction to a secondary port?
Start by identifying the secondary port nearest your route and the reference port it is linked to. Read the reference port’s high and low water times and heights for your date. Then apply the time and height differences printed for your secondary port, using the row for the state you need, high or low water. The arithmetic is simple:
Secondary port time = reference port time + time difference Secondary port height = reference port height + height difference
Apply each difference with its sign, as printed. A negative difference is subtracted. Watch for two traps. First, a time difference can move an event across midnight, so check the date as well as the clock. Second, confirm that the figures are given on the time basis stated at the front of the volume, and that you apply the difference on that same basis.
Do not choose a secondary port simply because it is close by road. Tidal arrival times change along the coast and up the bay’s arms, so a difference that works at one location can be wrong a few kilometres away. Choose the listed port whose shoreline and exposure most resemble your own, and treat the result as a prediction for that place only.
How do you estimate the height of tide between high and low water?
Tide height does not change in a straight line between high and low water, so a simple linear guess can be noticeably wrong. The volume contains a section titled Calculation of Intermediate Times or Heights that sets out the CHS method. Follow that method exactly, using the values from the same reference and secondary ports, and write the result down with its time, date and datum so that it cannot be mixed up with another port’s figure later.
For a passage, the useful question is rarely the height at a single instant. More often it is whether enough water will be available at the point you need to cross, and for how long. Work backwards from the depth your boat requires, then find the time window in which the predicted height stays above the level you need, with a safety margin added.
Why does chart datum matter when you read a tide height?
Chart datum is the low water plane to which the depths on a chart are referenced. CHS Chart 1 states that in tidal waters the reference plane is Lower Low Water, Large Tide or Lowest Normal Tide. These are low levels, chosen so that charted depths are conservative: at most times there is more water than the chart shows.
To estimate the depth at a given time, use this relationship:
Actual depth = charted depth + predicted height above chart datum
Chart 1 also notes that where the range of tide is small, meteorological disturbances may cause even average tides to fall below chart datum. Some predicted heights can be negative, which means the water stands below chart datum at that moment. Check the sign carefully in your arithmetic, because a minus sign reverses the answer.
How do you use the tidal current predictions in the Bay of Fundy?
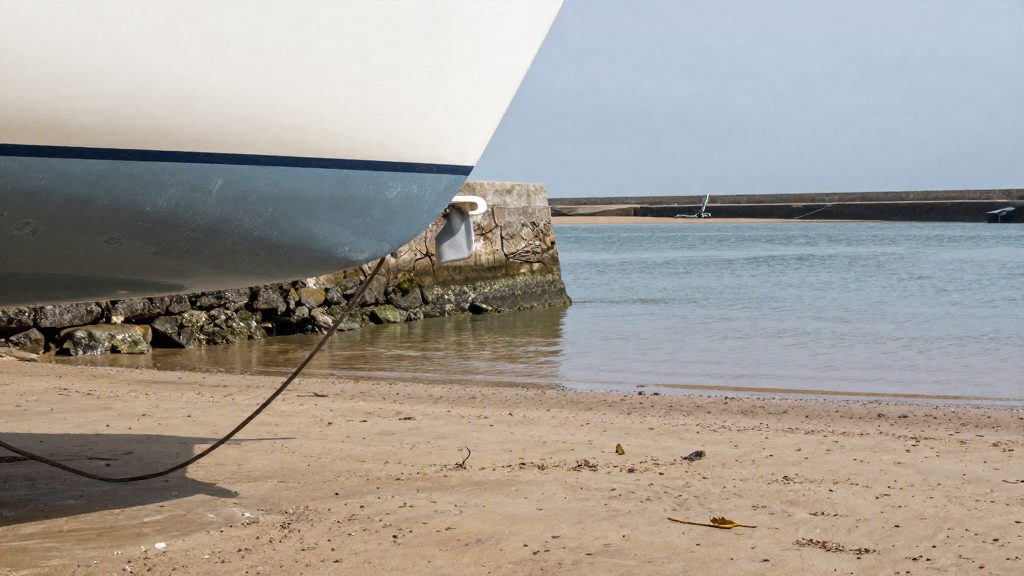
Current tables give the times of slack water and the times and speeds of maximum current. Slack water is the short period when the current is near zero before it turns. It does not coincide exactly with high or low water, so plan a crossing from the current table for that location rather than from the tide times. For the Grand Manan Channel, use the dedicated table in Volume 1, not an estimate taken from a nearby port.
For the broader picture of direction and strength through the tidal cycle, the Canadian Atlas of Tidal Currents for the Bay of Fundy and Gulf of Maine, Volume 1 (2015), gives currents at hourly intervals. Its Bay of Fundy section covers the main bay, and a separate section covers the Minas Basin and Shepody Bay. The atlas is used with the Saint John predictions from the tide and current tables as its reference. A workable sequence is this: read the time from the tables, find that hour in the atlas, read the direction and speed at your location on the chart, and then check the result against the current table.
Currents run faster and turn at different times in narrow passages and around headlands, and eddies form on sheltered sides. The atlas gives the broad pattern; a local hazard can be stronger than the charted value on a given day.
When should you not rely on the tables alone?
Predictions describe the astronomical tide under normal conditions. Strong winds, particularly those blowing directly onshore or offshore, and changes in air pressure can make the observed water level higher or lower than predicted, and can shift the timing as well. When that happens, the tables are no longer a reliable guide to the water you actually have.
The danger on the bay’s flats and shorelines is that the flood can cut off return routes faster than expected. Plan your return time with a margin, not as the latest possible moment. If the water is not behaving as the tables suggest, higher, lower, or turning at a different time, stop the plan, reassess, and head for a safe anchorage or harbour before continuing.
Tide tables do not tell you whether conditions are safe to launch. Combine them with the current marine forecast from Environment and Climate Change Canada, your local knowledge of the place, and your own assessment of the boat and crew.
What should you check before you sail?
- Confirm that you hold the current edition and the pages for your reference and secondary ports.
- Write down the reference port’s high and low water times and heights for the date, then apply each secondary port difference with its sign.
- Confirm the time basis stated at the front of the volume, and check whether any event crosses midnight.
- Calculate the height you need using the CHS intermediate method, not a straight line.
- Convert the predicted height to depth using chart datum, and compare it with the charted depth at your crossing point.
- Mark the slack water times for each channel crossing and the usable window around them.
- Check the marine forecast before departure, set a turnaround time with a margin, and leave your route and return time with someone ashore.
Frequently asked questions
What should I do if the secondary port I need is not listed?
Use the nearest listed secondary port only if its shoreline is comparable to yours, and check with a local harbour authority before relying on it for a crossing. The official sources consulted do not set a maximum distance for applying a difference.
How far ahead can I plan with the tables?
The official sources consulted do not state a maximum look-ahead in the pages reviewed. Check that the edition you hold covers the dates you intend to sail.
Is it safe to walk out onto the exposed flats at Hopewell Rocks at low tide?
Only by following the site’s posted timing and local guidance, and by leaving well before the water begins to rise. The tables do not show how quickly the flats will flood on a given day.