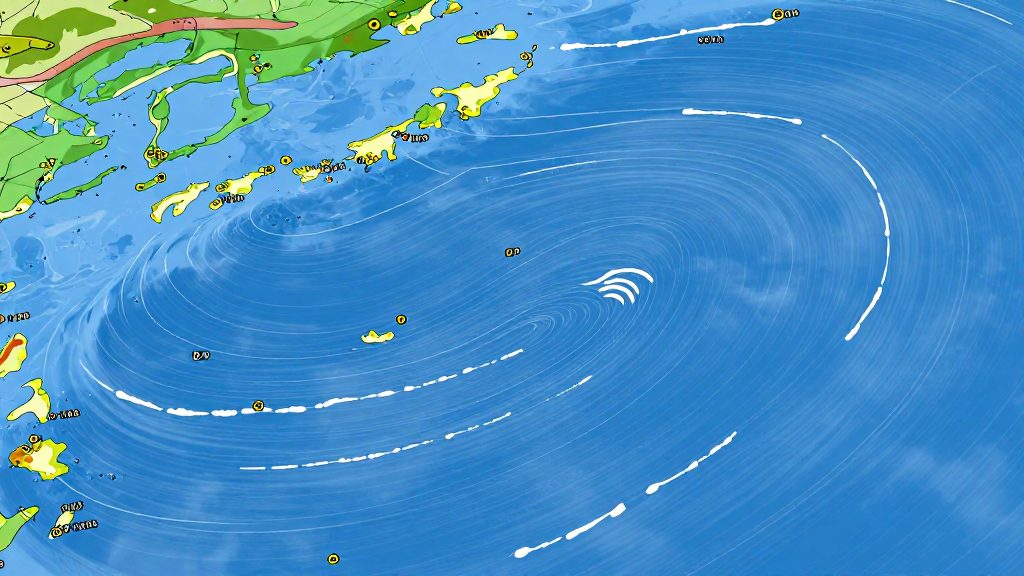
High and Low Pressure Systems on Synoptic Charts
Interpreting pressure centers is the first step in assessing overall weather stability for your voyage. On standard synoptic charts, a high-pressure system is marked with a blue capital “H.” In the Northern Hemisphere, air circulates clockwise around this center while descending, which typically suppresses cloud formation and leads to fair, stable conditions. Conversely, a low-pressure system is identified by a red capital “L.” Here, air circulates counter-clockwise and ascends, promoting cloud development and often resulting in unsettled or stormy weather.
The intensity of the wind is determined not just by the center itself, but by the isobar spacing. Isobars are contour lines connecting points of equal atmospheric pressure, conventionally drawn at 4-millibar intervals. When these lines are tightly packed, they indicate a steep pressure gradient, which drives strong winds. Widely spaced isobars signal a weak gradient and lighter air movement. By observing the density of these lines between a high and a low, you can gauge the potential wind force before it hits your vessel.
How Do You Decode Wind Barbs and Directional Arrows?
Reading wind barbs on a marine forecast chart is a fundamental skill for safe navigation. The symbol consists of a central shaft with feathers extending from it. The shaft orientation is the first element to interpret: it always points in the direction from which the wind is blowing. If the shaft points north, the wind is coming from the north and blowing toward the south. This convention aligns with standard meteorological practices used by NOAA and the WMO.
To determine wind speed, you must sum the values of the individual feathers attached to the shaft. The system uses a standardized scale where each feather type represents a specific increment in knots:
| Symbol Component | Value (Knots) |
|---|---|
| Short barb (half-barb) | 5 |
| Long barb (full barb) | 10 |
| Filled triangle (pennant) | 50 |
For example, a shaft with two long barbs and one short barb indicates a wind speed of 25 knots. When winds reach high-speed thresholds, a pennant (a filled triangle) replaces multiple barbs to indicate 50 knots. This symbol is critical for identifying hurricane-force or severe storm conditions, allowing boaters to assess whether conditions exceed safe operating limits for their vessel.
Reading Frontal Boundaries and Troughs
Interpreting frontal boundaries on marine weather charts allows boaters to anticipate rapid changes in wind, visibility, and sea state. The primary distinction lies in the line style and associated symbols, which indicate the type of air mass interaction and the resulting weather transition.
Cold fronts are depicted as a solid blue line with triangles pointing in the direction of movement. These boundaries typically bring abrupt wind shifts, dropping temperatures, and convective squalls or thunderstorms. In contrast, warm fronts appear as a solid red line with semicircles pointing in the direction of movement. They generally signal widespread cloudiness, steady precipitation, and rising temperatures, often providing a longer window for preparation compared to the sudden onset of a cold front.
When a cold front overtakes a warm front, an occluded front forms, represented by alternating purple triangles and semicircles. This configuration usually indicates a mature low-pressure system with complex, often unsettled weather patterns. Stationary fronts, shown by alternating red semicircles and blue triangles pointing in opposite directions, mark an air mass boundary with little to no movement. These can lead to prolonged periods of precipitation or stable conditions, depending on the air masses involved.
Troughs are identified by dashed or solid bold lines, often labeled “TROF.” They indicate an elongated area of relatively low atmospheric pressure without a closed circulation. Troughs are frequently associated with wind shifts and the development of localized weather disturbances, making them critical for planning routes that cross open water.
Decoding Station Plots and Barometric Tendency
When analyzing a standard marine weather chart, the individual station plot provides the most immediate data for assessing local atmospheric conditions. The primary focus here is the barometric tendency, which indicates how pressure has changed over the preceding three hours. This data is plotted to the right of the station circle, below the sea-level pressure reading. It consists of a 3-hour pressure trend curve or trace symbol, accompanied by an adjacent number representing the net pressure change over the prior 3 hours in tenths of a millibar (hPa). It is important to distinguish this from the wind barb shaft, which is the line extending from the station circle; the shaft indicates wind direction and speed, not pressure tendency.
To interpret the current conditions accurately, you must first decode the current pressure reading. On standard synoptic charts, pressure is displayed as a three-digit number representing tenths of a millibar. To convert this to the standard unit, you must mentally insert a “9” or “10” in front of the number and place a decimal point to yield a value closest to 1,000 millibars. For example, a reading of “023” would be decoded as 1002.3 millibars. This standardized format ensures consistency across international meteorological services.
Additionally, the spread between the temperature and dew point offers critical insights into humidity levels. A small difference between these two values suggests high relative humidity, which often leads to fog, mist, or cloud formation. A large spread indicates dry air, which is less likely to produce precipitation. By combining the direction of the pressure tendency with the current pressure value and the temperature-dew point spread, you can form a reliable assessment of the immediate atmospheric state.
What Do Marine Weather Warnings and Flag Symbols Mean?
Understanding official advisory symbols is essential for assessing navigational safety before and during a voyage. The National Weather Service (NWS) issues specific marine warnings based on sustained wind speeds and sea conditions. A Small Craft Advisory is issued when sustained winds or frequent gusts reach 20 to 33 knots, or when hazardous localized seas are present. As conditions intensify, a Gale Warning is declared for winds between 34 and 47 knots. More severe conditions trigger a Storm Warning for winds of 48 to 63 knots, while a Hurricane Force Wind Warning applies to non-tropical systems with winds of 64 knots or greater.
These warnings are often accompanied by flag color codes and hoisting protocols used in harbor and coastal areas. The U.S. Coastal Warning Display System is standardized nationally to ensure clear communication of risk levels. A Small Craft Advisory is indicated by one red pennant. A Gale Warning is signaled by two red pennants. A Storm Warning is represented by one square red flag with a black square center, while a Hurricane Warning is indicated by two square red flags with black square centers. Operators must understand these standardized protocols to ensure they are not caught in deteriorating conditions.
Warning issuance criteria are tied to specific timeframes and forecast models. The NWS evaluates atmospheric data to determine when wind thresholds will be met. It is critical to monitor these updates regularly, as weather patterns can shift rapidly. Under USCG navigation rules, specifically Rule 5 (Look-out, 33 CFR § 83.05), every vessel operator is required to maintain a proper lookout by sight, hearing, and all available means appropriate to prevent collisions. However, neither Rule 5 nor federal navigation rules require recreational vessels under 20 meters (65.6 ft) to carry a VHF marine radio or monitor weather broadcasts. While carrying a VHF radio is not legally mandated for smaller recreational vessels, maintaining a proper lookout and assessing all risks remains a fundamental obligation for safe navigation.
Sea State, Swell Periods, and Wave Height Notations
Interpreting wave data requires understanding three distinct components: significant wave height, swell period, and swell direction. These elements combine to define the overall sea state, which is critical for assessing vessel stability and safety.
Significant wave height is the standard metric used in marine forecasts. It represents the average height of the highest one-third of the waves in a given area. On charts, this is typically denoted by a numerical value in feet or meters. A higher value indicates a rougher sea state, regardless of wind conditions.
Swell period measures the time interval between successive wave crests. It is usually expressed in seconds. A longer period generally indicates a more organized and powerful swell, often generated by distant storms. Shorter periods are associated with local wind chop. When reading a forecast, a long period combined with a moderate height can be more hazardous than a short period with a higher height, as it creates a more rolling motion that affects vessel handling.
Swell direction is indicated by arrow symbols pointing in the direction the waves are traveling. This is distinct from wind direction. Cross-seas, where swells from different directions meet, create complex and potentially dangerous wave patterns. Identifying the primary swell direction helps in planning a course that minimizes beam seas.
Sea state descriptors often accompany numerical data, using qualitative terms to describe wave form and intensity. These descriptors help boaters quickly gauge conditions without performing calculations.